
Introducing AAG’s New ChatGPT-Powered Monitoring Insights
Modern monitoring systems are excellent at collecting data such as metrics, status checks, thresholds, etc… But when something “looks” wrong, the real work begins… digging through graphs, correlating signals, and figuring out what actually matters.
Today, we’re excited to announce a new AAG feature we are working on, which will bridge that gap.
With a single click inside your existing Nagios monitoring, you can now ask ChatGPT to analyze recent monitoring data, identify anomalies, and surface potential problems without exporting data, switching tools, or manually interpreting raw metrics.
Nagios already tells you what is happening; a service is flapping, latency is passing thresholds, error rates have spiked, or a check is behaving differently than usual. What it doesn’t tell you is; why this might be happening, whether the behaviour is abnormal, or what patterns stand out across recent data. That interpretation usually lives in a system admins head.
This new AAG analysis feature aims to help answer those questions instantly.
AAG will now allow users to request an AI-driven review of monitoring data collected over the last (N) seconds, directly from the Nagios interface.
AAG will then package the relevant monitoring data and send it to ChatGPT, which returns a human-readable analysis highlighting:
- Unusual behaviour or deviations, Emerging trends
- Correlated signals that might be easy to miss
- Potential explanations worth investigating

This feature is not a separate dashboard or external tool. It will integrate directly into your Nagios interface.
- A user clicks the AAG AI Analysis button (currently the notes url…)
- AAG gathers the relevant monitoring data
- ChatGPT analyzes the data and returns insights directly to the user
No context switching. No exporting metrics. No copying graphs into another system.
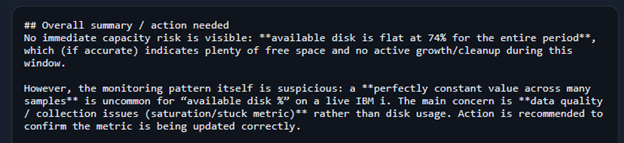
The output is designed to be clear, concise, and actionable, not vague or overly verbose. The first point highlighted is a simple overview. Stating if user action is recommended and the overall status of the service.
After the overview, each detailed analysis point will be printed out…
The prompt is currently tuned to outline the following:
- Outliers

- Step Changes

- Saturation

- Correlated Anomalies (not currently used in this test as we are using a single data point)
Finally, to wrap up… an outline of possible issues and remedies is listed. This can also include how to verify data and other points ChatGPT thinks is relevant.

This feature will be especially valuable for:
- Faster incident triage – understand what’s happening before digging into raw data
- Reducing alert fatigue – distinguish real issues from noise
- Junior engineer enablement – assist with insights that normally require deep experience
- Post-incident review – quickly summarize what was abnormal during a time window
It effectively turns monitoring data into a conversation, not just a collection of numbers.
If you are interested in adding this feature to your AAG Nagios Plugin, feel free to reach out!
Cheers,
Charlie